It is quite common today to hear big data referred to as the happiest intuition of this century, but it is well known that the collection of large quantities of data, combined with arcane – for most people at least – mathematical formulas, is at the base of actuarial science. The insurance sector has always counted on this scientific discipline to envisage its future, calculated according to a rigorous method, to try to best emulate the words of Benjamin Franklin: “In this world nothing can be said to be certain, except death and taxes.”
Specific technologies and analytical methods help to manage this enormous amount of data to obtain information that may support the analyses: but in some cases, our predecessors had to rely on more “practical” methods, as happened with the hail sector. Founded in 1836 based on a proposal made by Secretary General Masino Levi, in 1890 this sector was assigned to two subsidiary companies: one with offices in Milan, Anonima Grandine, operating in Italy, and one in Budapest operating in the territories under the Austro-Hungarian empire. This solution was formulated because the company could count on “valuable statistical materials” and a “network of agents who already have long reach into the sector”, therefore assigning the business to companies established for this purpose.
")
With regard to Italy, the agents were required to collect data concerning the rates of weather-related claims through specific postcard forms. These forms had to be completed with notes about the characteristics of each storm or the effects of the same (frequency/intensity/types of lightning strikes, thunder and hail, as well as wind direction), sending these to the Venetian Management Head Office and then sending them to the central weather office in Rome, with which the Company had collaborated with since 1881.
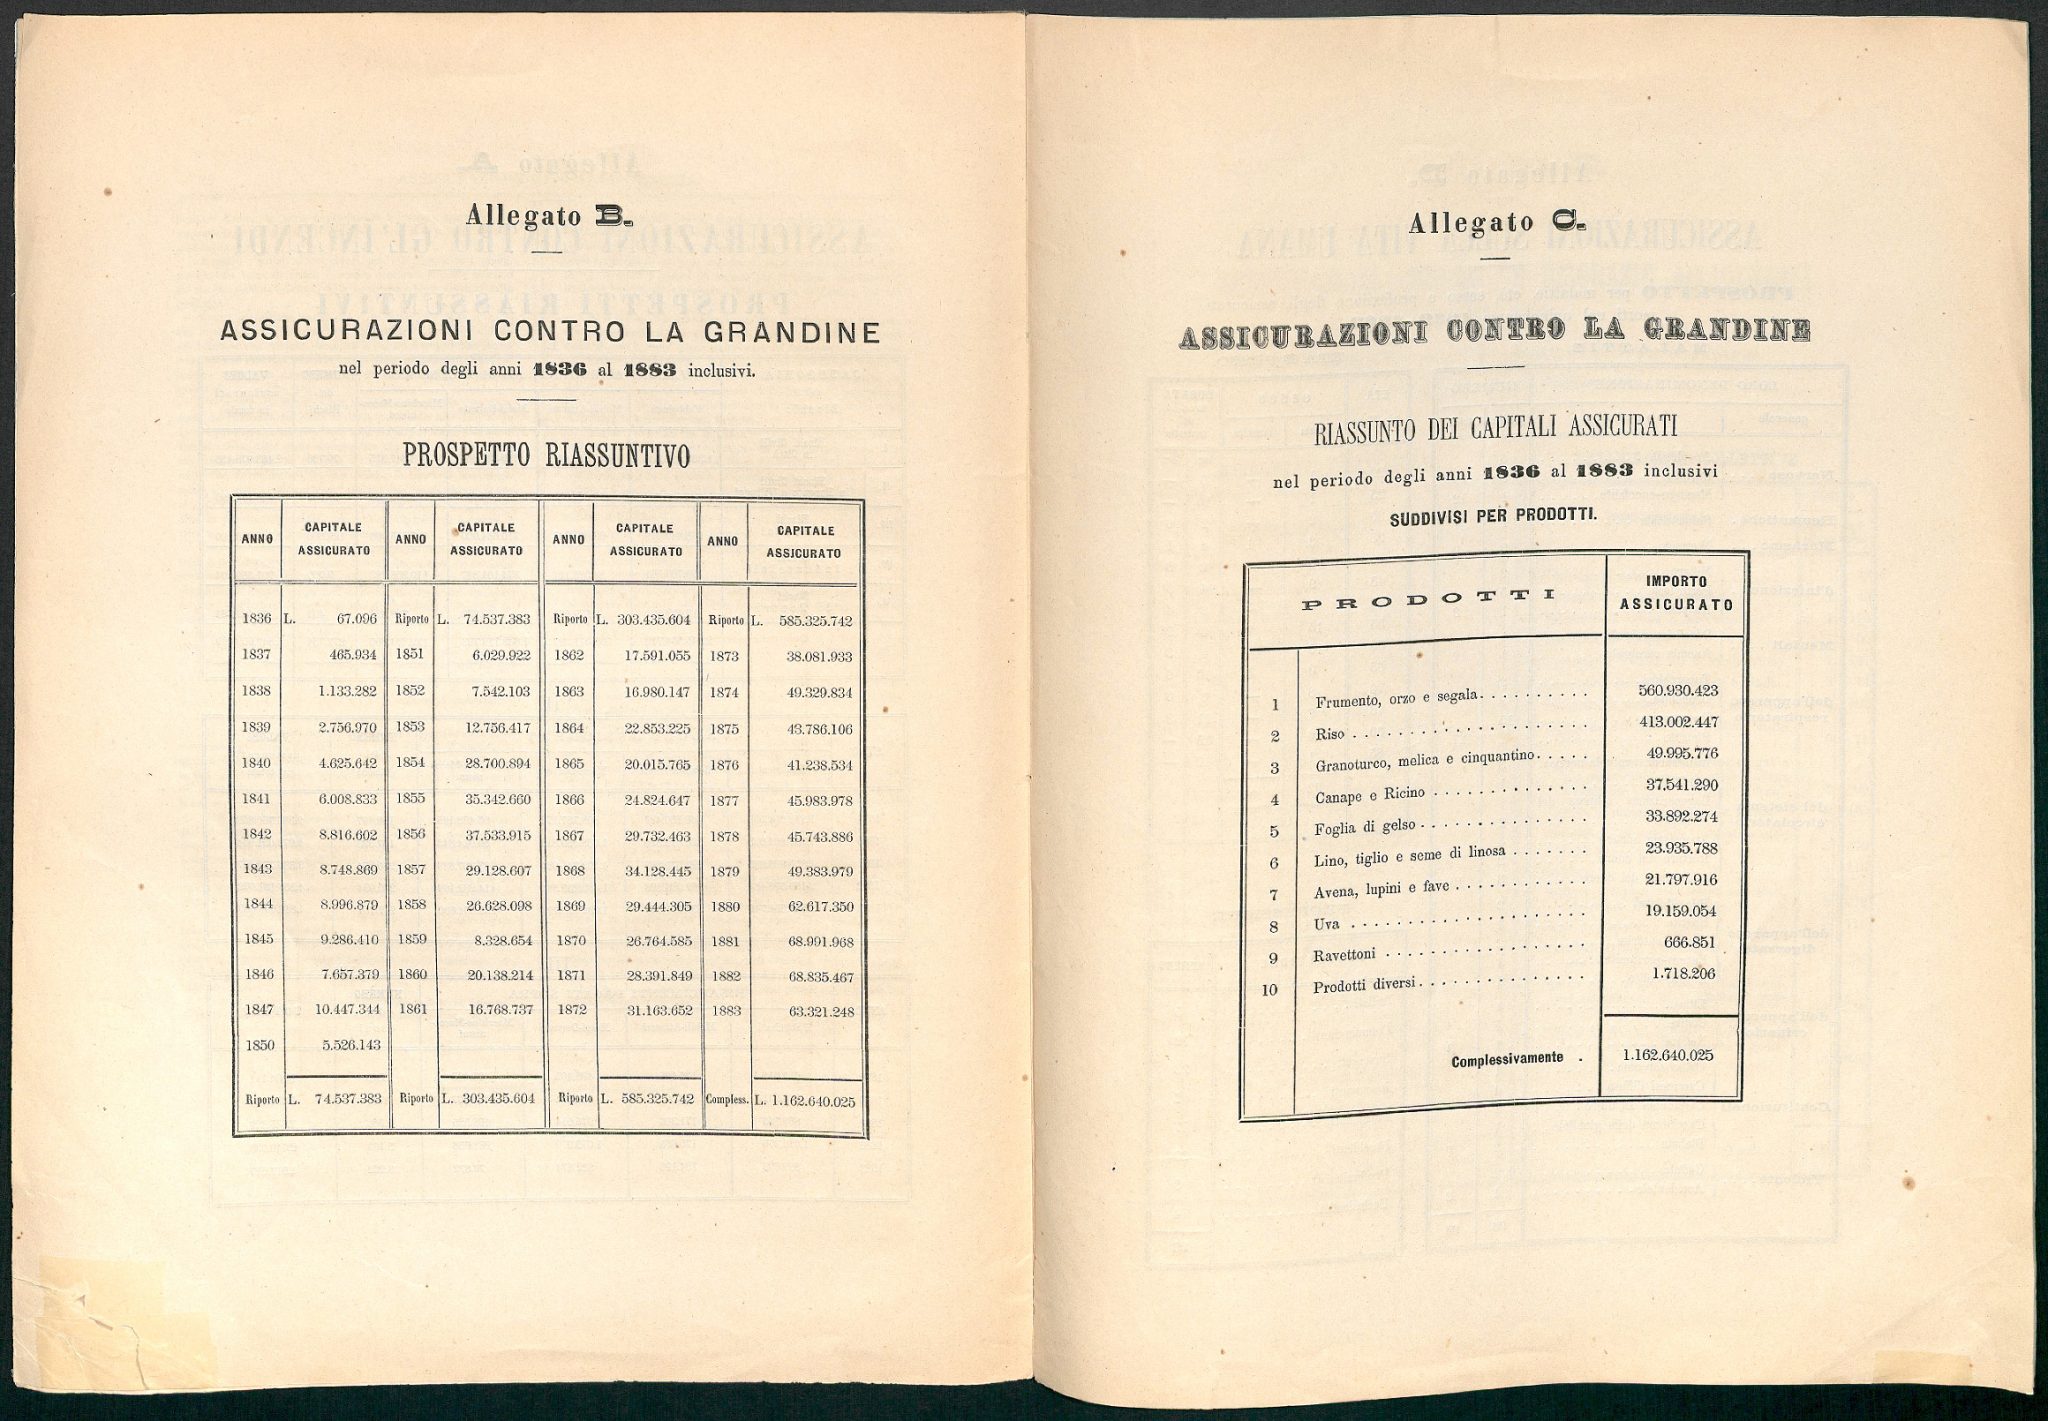
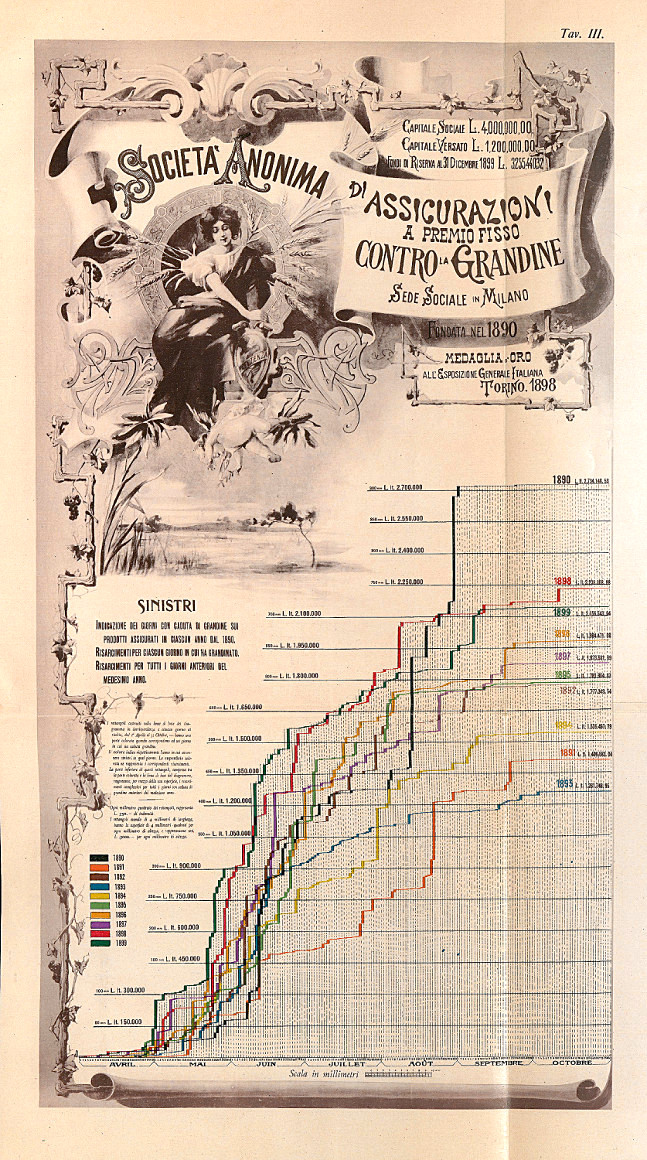
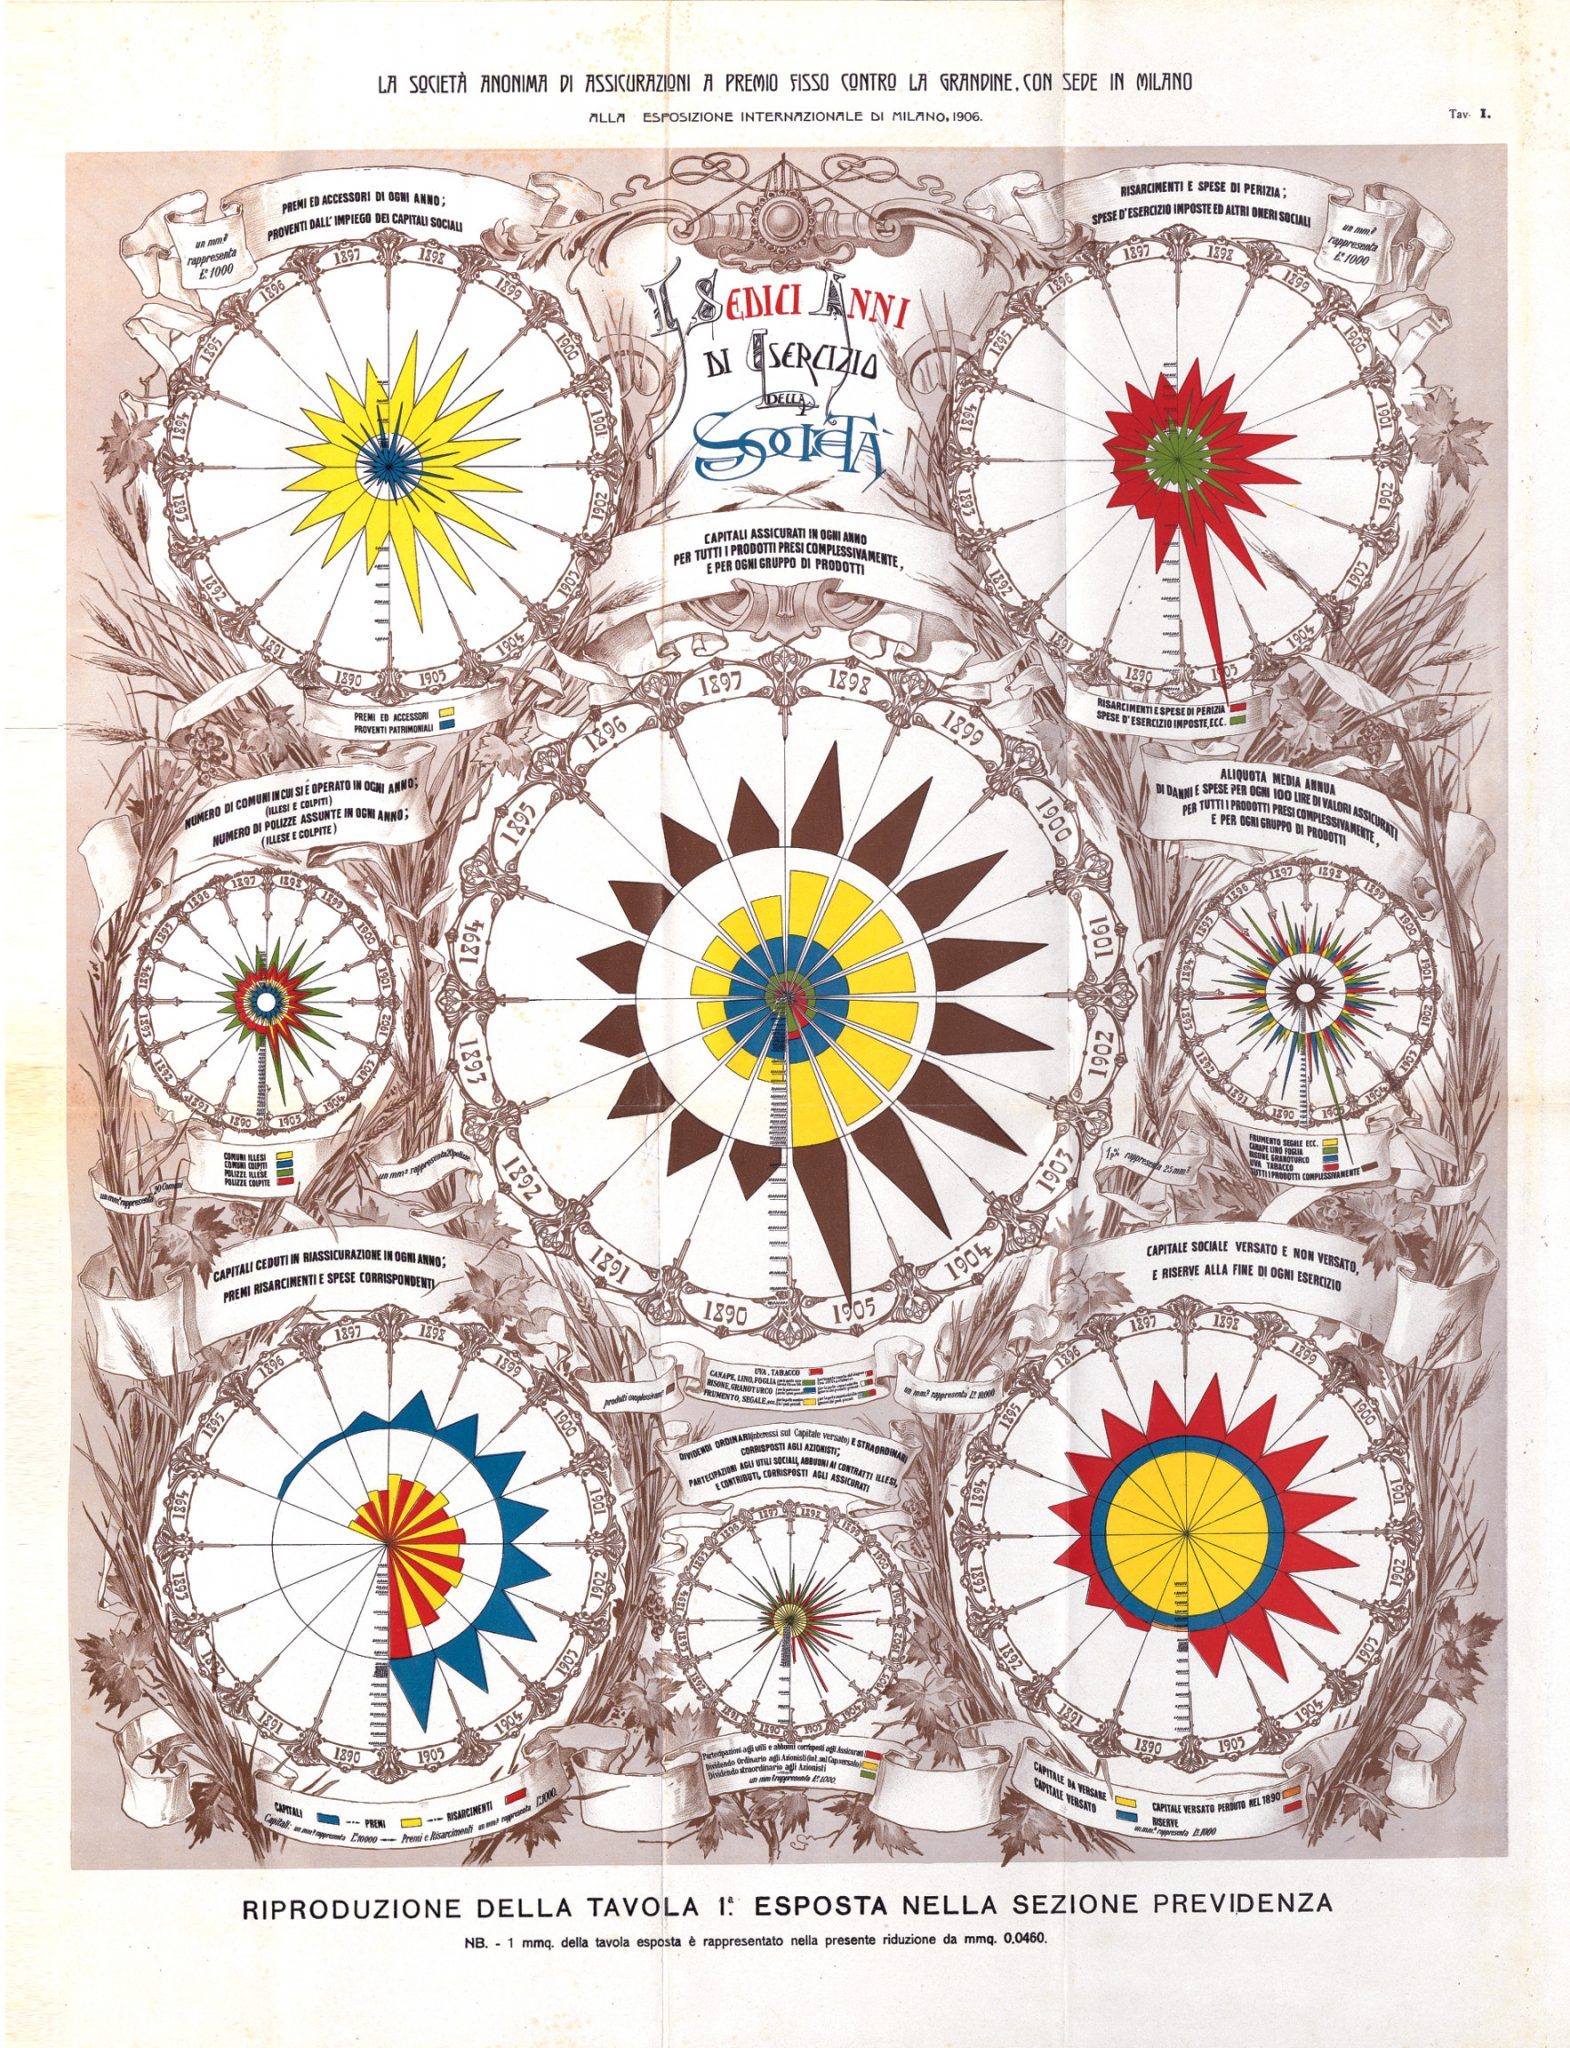
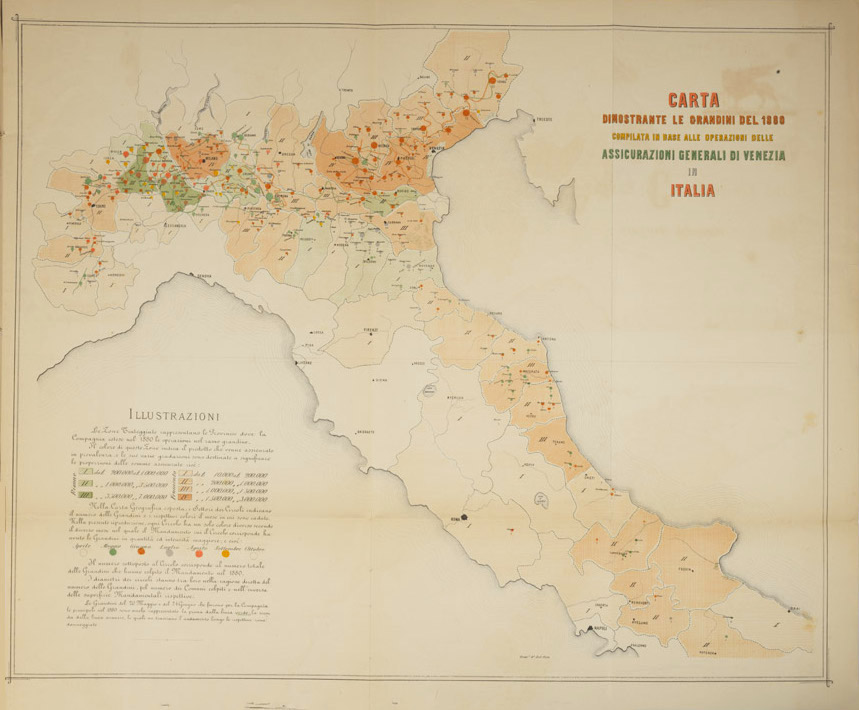
This material, in addition to being obviously practical, was also used for creating diagrams and charts which then accompanied the Memorie, prestigious publications drafted for large-scale universal exhibitions, where the statistics, technical data and complex research in the insurance sciences were represented in coloured tables.
For example, in the “Hail Chart for the year 1880”, accompanying the publication drafted for the Italian Industrial Exhibition of Milan in 1881 (the first edition that was participated in by Generali), the different colours indicate the prevalence of the insured product in each province. The Mandamenti (districts) hit by hail were represented by circular shapes of different sizes according to the number of hail storms and the surface area they referred to: each circle has only one colour, which changed based on the month when the Mandamento to which the circle corresponded recorded hail in higher quantities and intensities, while the numbers outside of the circles indicated the total number of hail storms that occurred in the Mandamento over the course of the year. In particular, a higher rate of hail phenomena was recorded in the Po River basin, with concentrations on the dates May 29 and June 24; each incident can be tracked along the centres that were hit.
An “on-site” data collection effort was effective not only for ensuring that the hail sector would be less “uncontrolled and uncontrollable” for the companies working in the sector, but also for advancing the study of weather phenomena… in real time!
More information in S. STENER, Uncontrolled and Uncontrollable. The Growth of Hail Insurance: From Branch to Company, in Generali in History. Tales from the Archives. Nineteenth Century, Venice, Marsilio, 2016, p. 132-137.